In this story · 4 sections
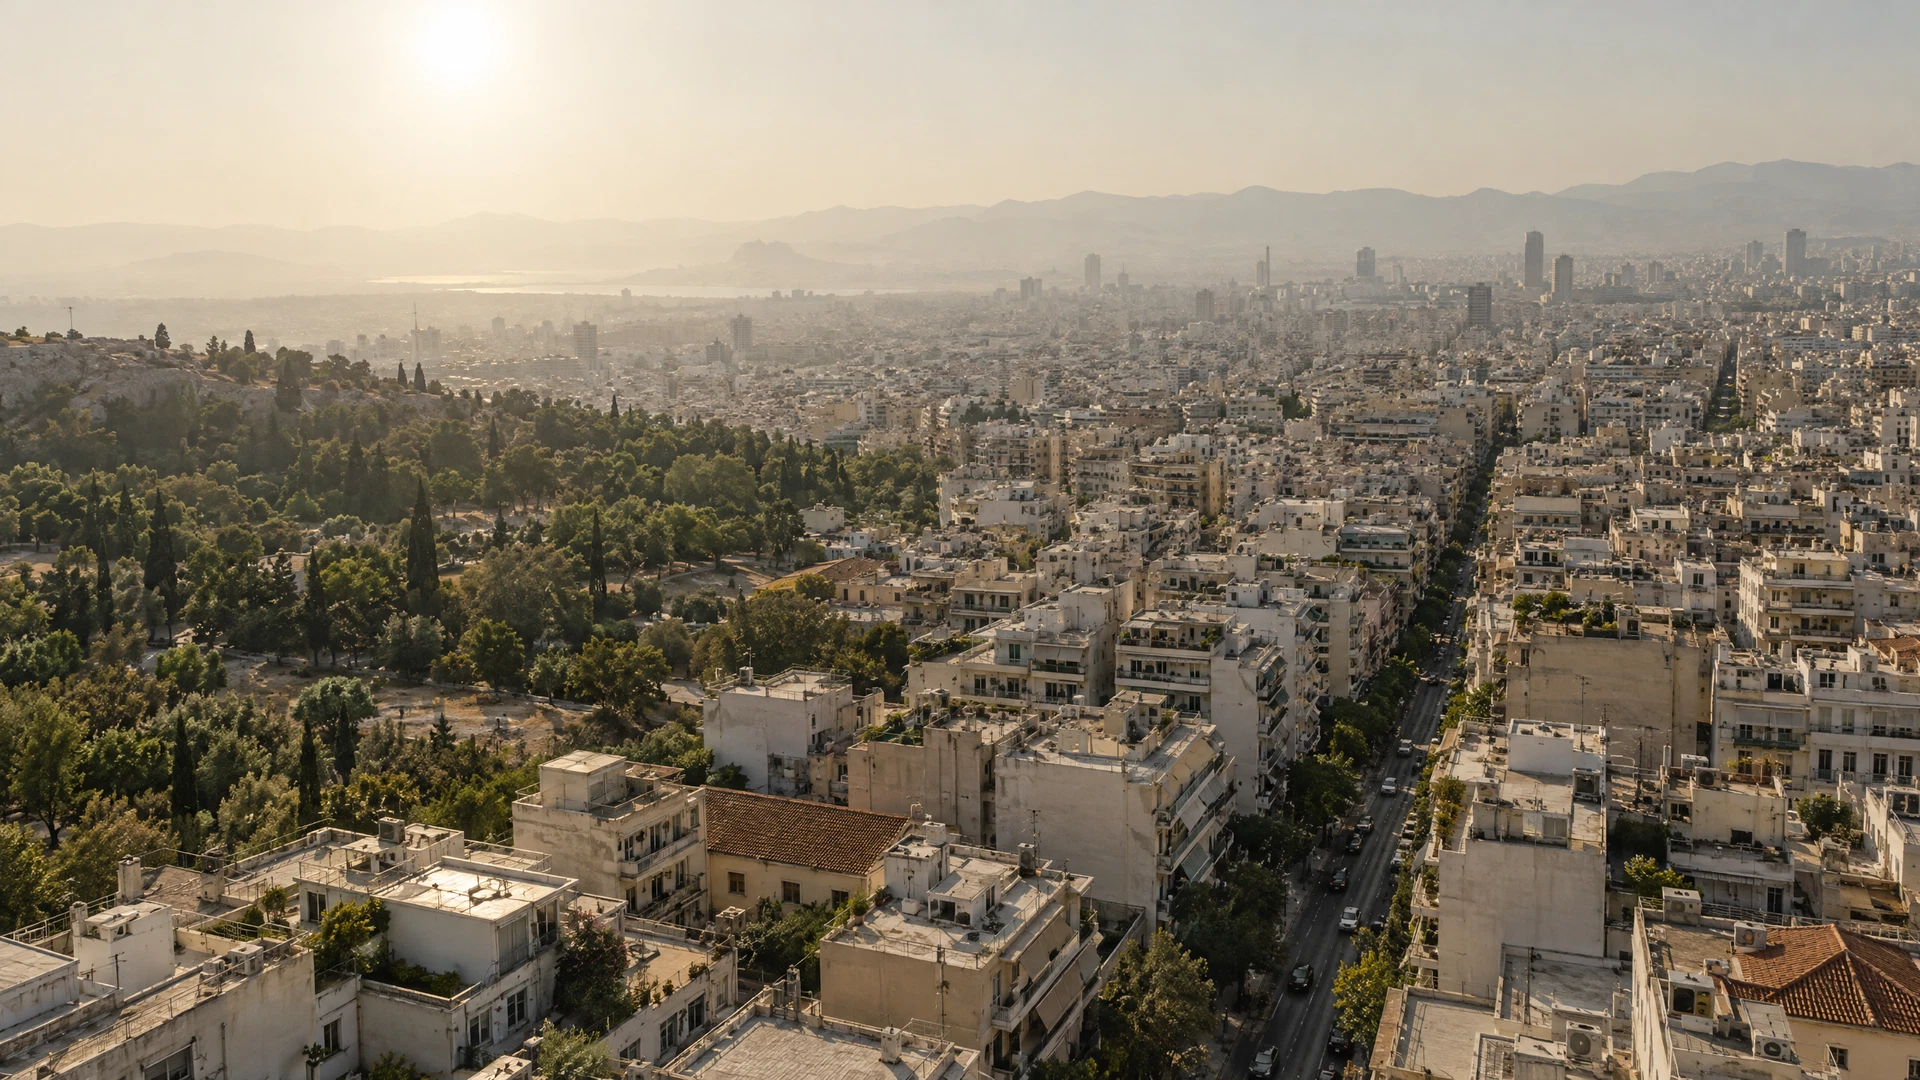
A satellite image of a city during a heatwave is a map of averages. It shows that the city is hot. It does not show that one side of a street is hotter than the other, or that a ground-floor flat with a single window is hotter still.
Urban heat is not uniform. It follows trees, asphalt, building density, ventilation and the distribution of air conditioning. It also follows income.
The measurement gap
Most cities rely on a handful of weather stations. That is enough for a forecast and not enough for a policy. A new wave of projects is installing dense networks of low-cost sensors, often in collaboration with residents.
The data is messier than official records, but it captures variation that official stations miss. A sensor on a balcony is not a meteorological instrument. It is a witness.
The average temperature of a city is a useful fact for a weather report and a useless fact for a person choosing where to sleep.
What the data shows
Early results from several cities are consistent: canopy cover is the strongest predictor of street-level temperature, followed by building density and the amount of unshaded paving. The differences can be several degrees.
Those differences matter for health. Heat illness is concentrated among older people, outdoor workers and people without cooling. A city that measures only its average cannot see the neighbourhoods where the risk is highest.
Context
The equity problem
Planting trees is cheap compared with retrofitting buildings, but trees take years to mature and need water. The neighbourhoods that most need shade are often the ones with the least maintenance budget.
From measurement to action
Some cities are using the data to prioritise tree planting, open cooling centres and change rules on pavement materials. Others are using it to negotiate with utilities about air-conditioning loads.
The risk is that measurement becomes a substitute for action. A map of vulnerability is not a policy. But it is a start, and it is more useful than an average.
The limits
Sensors measure air temperature, not the heat a body experiences. Humidity, wind, radiant heat from walls and the ability to open a window all matter. Researchers are experimenting with indices that combine these factors.
The most honest conclusion is that cities are only beginning to understand their own thermal geography. The instruments are improving. The question is whether the investment will follow the map.




Join the conversation
0 commentsNo comments yet. Add a considered thought — comments are moderated by the editors.